


Network Devices:
Netflow
NetFlow is a network protocol that collects IP traffic data to help monitor and analyze bandwidth usage. It provides detailed visibility into traffic flows between devices, enabling performance troubleshooting and capacity planning.
Overview
What are Network Devices?
At Datadog, Network Devices refer to physical or virtual hardware components—like routers, switches, and firewalls—that manage and direct network traffic. Monitoring these devices helps track performance, detect bottlenecks, and ensure reliable connectivity across your infrastructure.
Problem
Today we show users the rate of traffic passing between routers and the percentage of available traffic that can pass, but we are missing a critical piece of information: the actual volume of data passing across devices. Our customers rely on the directional, flow-level volume data between network devices and applications, to maintain and manage an optimal network.
Opportunity
By adding directional volume data alongside Network Device Monitoring (NDM), Datadog can uniquely position itself in the networks market. Today, engineers rely on multiple tools for device health and flow visibility—this feature will streamline workflows, improve troubleshooting, and enable future cost optimization.
Role
End-to-end Senior Product Designer
About the User
USER PERSONANetwork Engineer
AKA Network Architects, Analysts, Technicians, or Administrators
Network Engineers are responsible for designing, implementing, and maintaining on-prem infrastructure. They balance long-term planning with day-to-day operations, ensuring performance, security, and cost efficiency across routers, switches, and appliances.
USE CASETroubleshooting Latency
When a site experiences slowness, Network Engineers need to trace traffic paths across multiple devices to pinpoint where latency occurs. This involves checking each hop—from source to destination—for signs of degraded health or abnormal traffic volume. Often, latency is caused by spikes or drops in directional traffic at key routers or switches.
Detect high-latency paths by correlating device health with traffic volume.
Identify spikes in ingress (requests in) or egress (responses out) traffic that may overload equipment.
Visualize the full traffic path across devices (IP-to-IP tracing).
Investigate anomalous drops in volume, not just spikes.
1. What is the maximum load we see between any two links? Which application is consuming the most bandwidth?
When an office network is flooded, Accenture needs to be able to determine which application is consuming the most available bandwidth. From their offices, most of the network requests are made by laptops on the internet that don’t have agents installed, so they can only get insight into the network from performance stats from their network equipment. They want to be able to see whether a business app is consuming all available bandwidth, or if all the laptops are streaming the world cup online, or torrenting a movie.
2. Capacity Planning & Cost Analysis
Accenture has an internal chargeback program where the network teams pull a monthly report to see the total bandwidth each team is using and charges them for usage based on the total available bandwidth and % used by each team.
What is NetFlow?
NetFlow is a protocol that collects metadata on IP traffic between devices. In Datadog, it provides visibility into who is talking to whom, how much data is being transferred, and in what direction—enabling engineers to troubleshoot performance issues and plan for capacity more effectively.

User Stories
3. What was the path traffic took to get from application A to application B?
At Liberty Mutual, an application team reports to the network team that there’s high latency coming from a single request, and will immediately assume it’s the network team’s problem.
For App A to make requests to App B it needs to communicate across a series of routers, switches, and other network appliances. Network engineers need to figure out which hop along the path is the source of the issue.
The network team often will know that an app lives on a server in one datacenter, in order for it to make a request to the other app, it will pass across multiple points, and the network team will need to check the health of all of the equipment along that path to determine whether or not the network is the culprit of that latency.
User Requirements
Designs
Wireframes
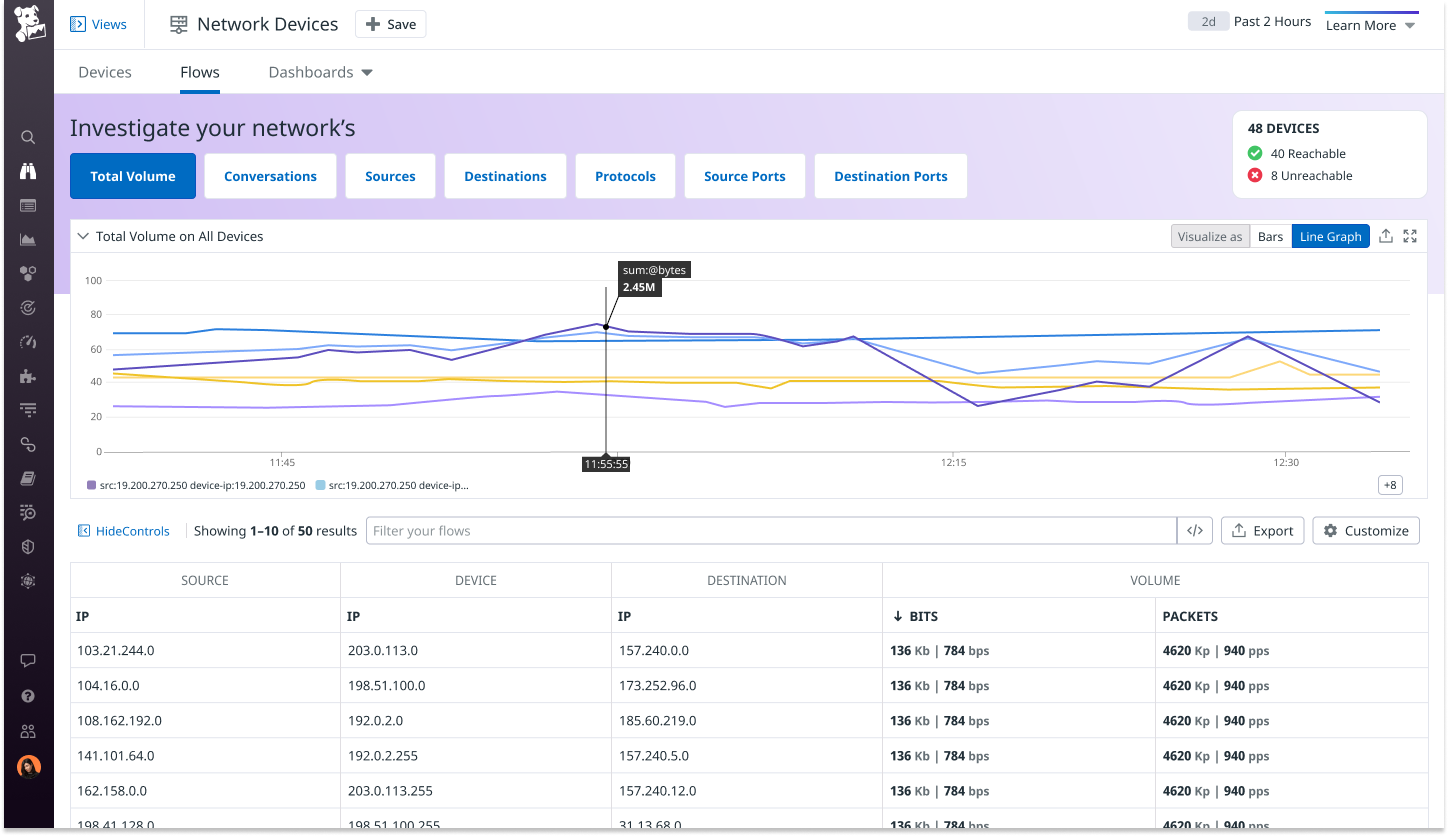
The NetFlow page is designed to be a deep-dive experience while remaining easy to navigate and providing a quick overview of a user’s flow data. Our initial layout surfaced top-level metrics and visualizations at the top, with raw data below.
While this structure offered clarity at a glance, it lacked a guided experience tailored to the user’s specific troubleshooting needs.
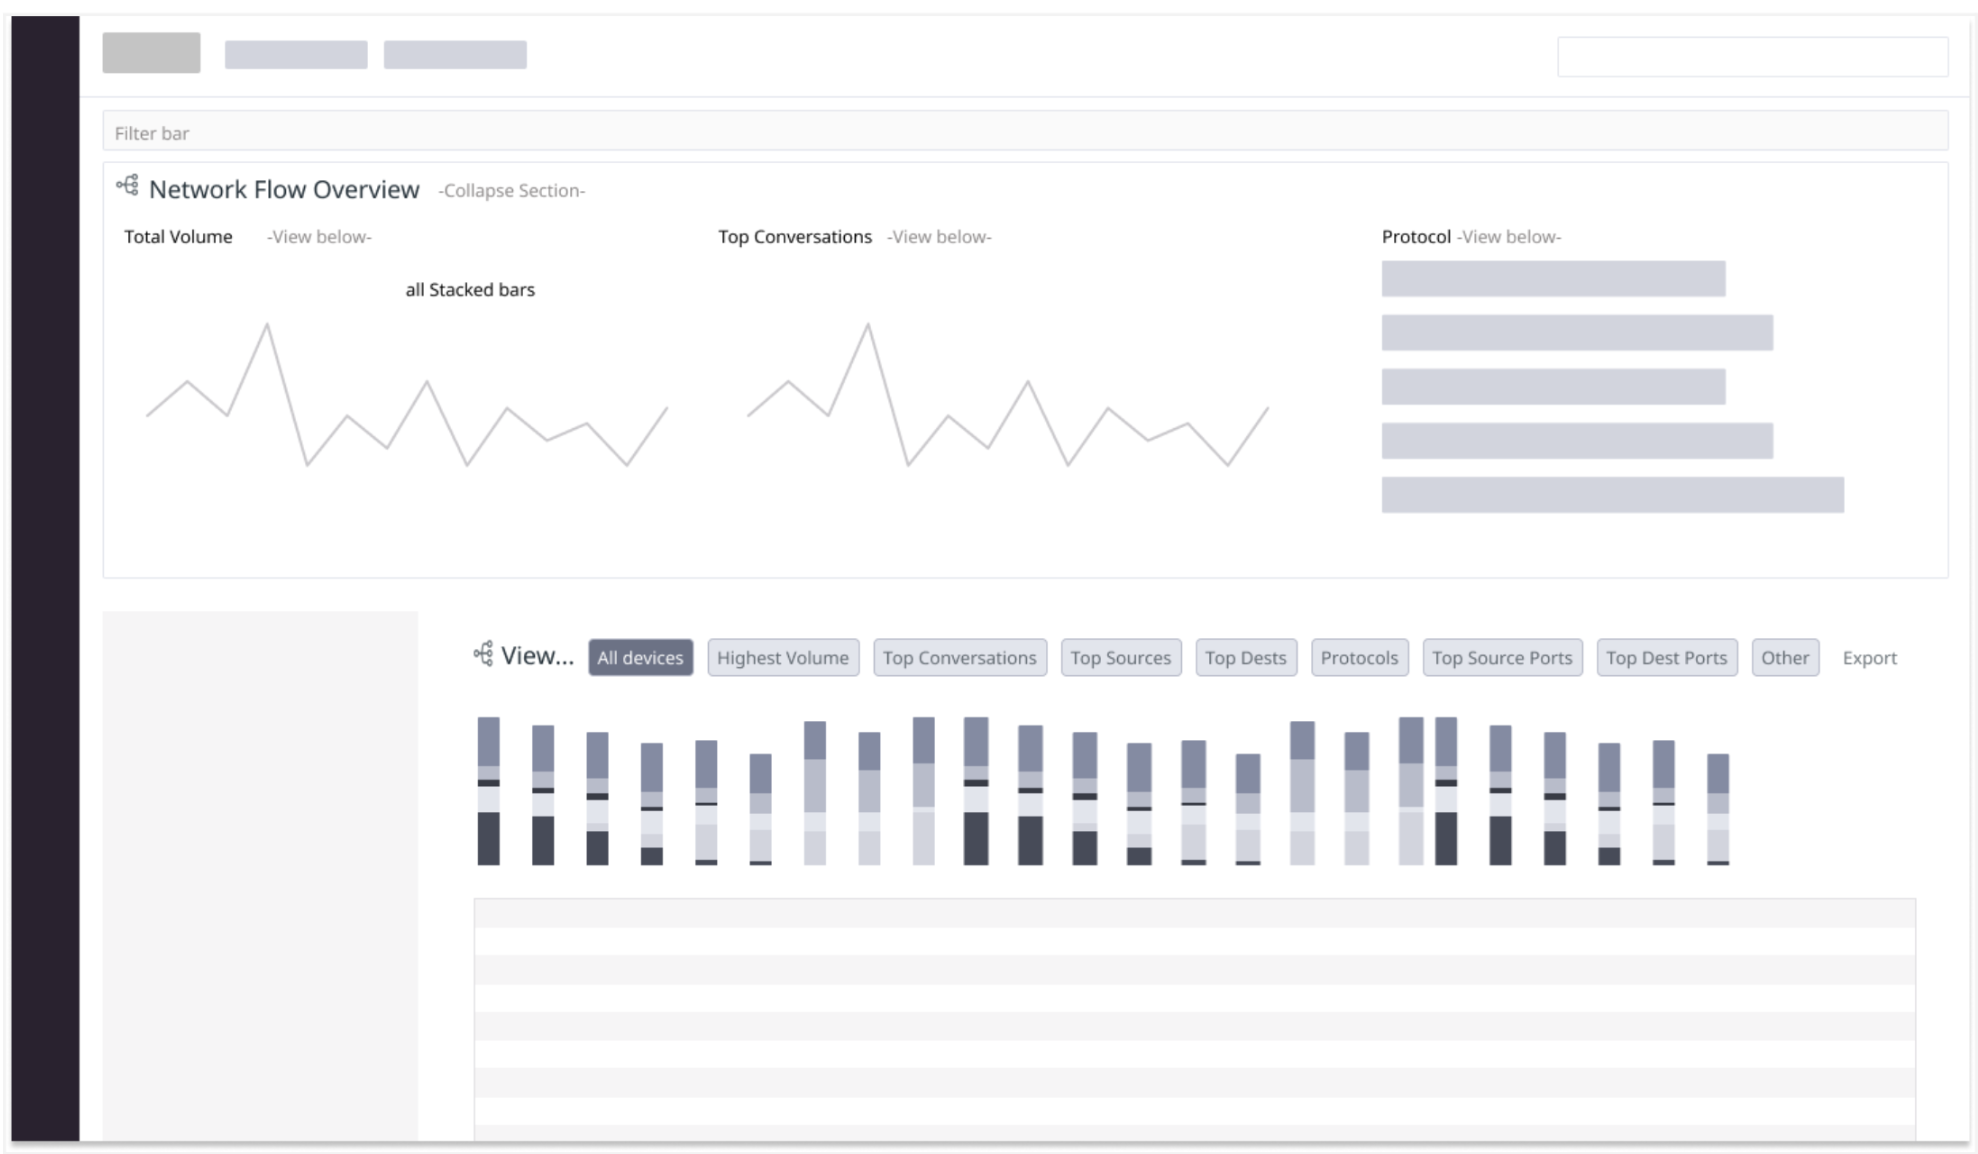
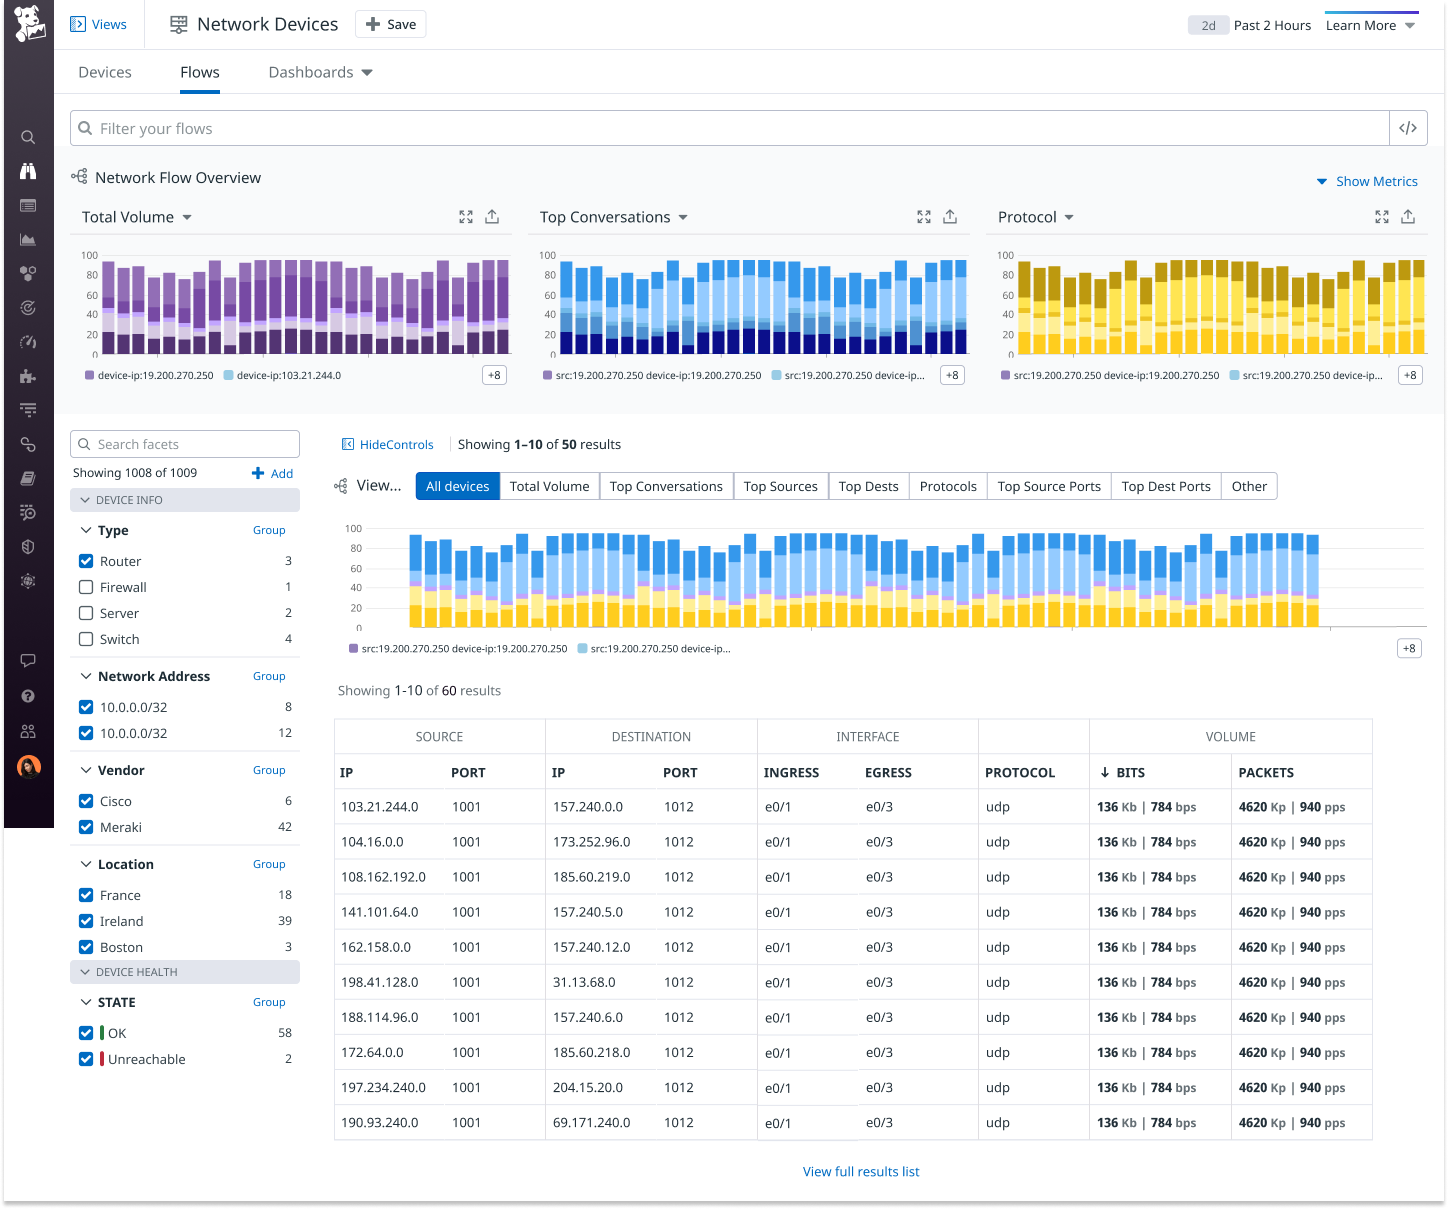
Figure 1. We showcased top-level metrics and accompanying visualizations with raw data below. The facet panel is also opened on the left for filtering purposes.
Designs
We wanted the visualization to be the main focus, so we gave it more space on the page and minimized distractions by closing the side controls by default. To help users clearly see which raw data connects to the chart, we simplified the layout by removing multiple overlapping graphs.
To better support specific investigative tasks, we introduced a new tabular layout. Each graph now lives under its own button, making it easier for users to explore different use cases. This approach encourages intuitive navigation and helps users learn the interface naturally—without the need for dedicated onboarding.
Prototype
View the end-to-end flow and multiple entry points in the prototype.
Quick links to a specific investigative view since we know Datadog can be hard to use and we know common user flows
Displaying the network device status widget for cohesion with our device page
Closing the facet panel by default
Increased size of visualization

Figure 2. In another approach, the top section focused on the traffic across all your devices and then you could drill into each flow below.
Impact
The launch of NetFlow quickly captured customer interest, becoming one of the most widely adopted features in our network tooling. It now plays a significant role in driving Network Devices revenue. Internally, the design has also influenced broader visual patterns and components that are now being adopted across the platform.
~$1.5M Revenue
>200 Orgs
~200 Monitored Flows
Patterns Influence
Quick Links
For the first time, users could quickly access the information they needed through top-of-page tabs that dynamically updated the entire view—establishing a new standard for consistency across the platform.

The Gradient
Netflow’s pattern was one of the first attempts to elevate the visual design within Datadog’s typically minimal system—using color gradients to draw attention to the primary content area, which you can see in this later version of Synthetic Monitoring.